|
Dyno Results
This section is dedicated to how much power my
engine makes, and has made in the past few years with different setups and such.
The most current graph will be on the top. The earlier ones were using a
Dynojet Dynamometer at CarbConn in Kirkland, WA. The most recent graphs
were using a Dyno Dynamics Dynamometer at Horsepower Connection in Olympia, WA.
I also did a run on a Mustang Dyno at a local shop as well. The
differences in these dynos are about 15% in wheel horsepower. The Dyno
Dynamics is more accurate and is great for steady state tuning. I will
reference the Dyno Dynamics results by adding 15% so they are comparable with
Dynojet, as that is what most people use to dyno their car. I personally
don't care about hp output as some do, I like having reliable results and
comparing past and present dyno graphs to see where more power can be earned.
The crank horsepower and torque values are considering a 17% drive-train loss.
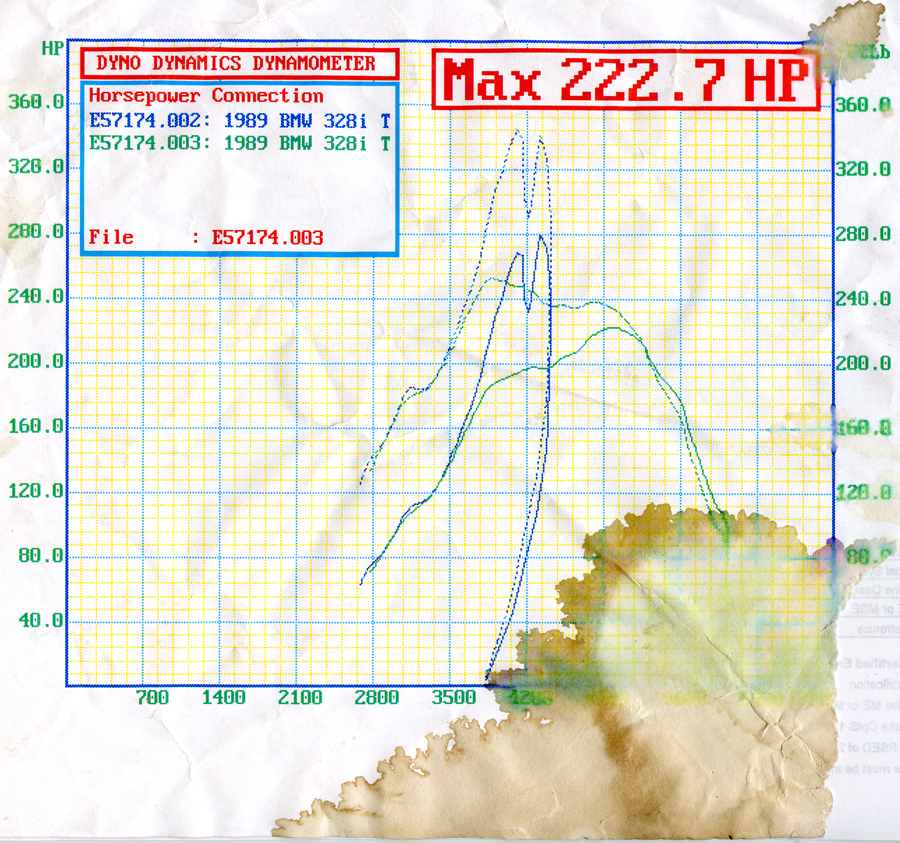
This dyno graph has one run at 8psi (green) and one run at 18psi (blue). I had a spark blow-out
(the spike down at 4krpm), and cut off the run, and didn't do any more.
The green run was also when I broke a rockerarm in the higher rpm. Sorry for the quality of the graph, its been everywhere.
Results: 280whp and 345wtq on the blue run. 222.7whp and 255wtq on the green.
As compared to a Dynojet: 329whp and 405wtq one the blue run. 262whp and 300wtq.
Crank horsepower: 396hp and 487ft-lbs on blue. 315hp and 361ft-lbs.
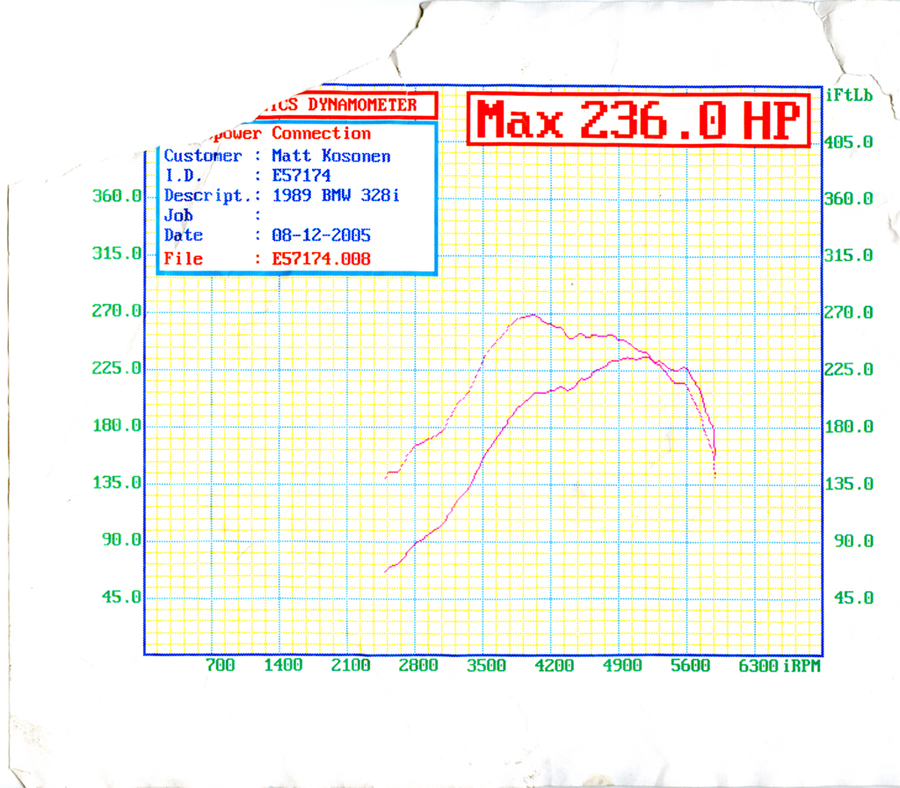
This was a good pull at 10psi.
Results: 236whp and 270wtq
As compared to Dynojet: 277whp and 317wtq
Crank horsepower: 333hp and 381ft-lbs
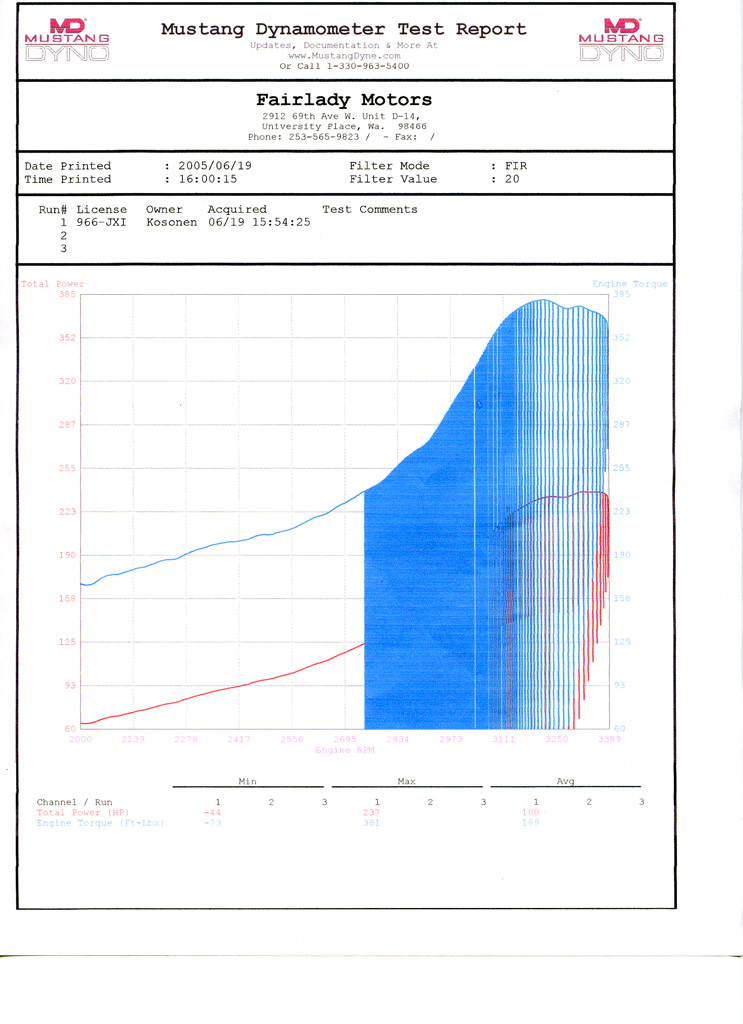
This dyno graph is from a Mustang dyno, my clutch slipped when the torque hit at 17.6psi, so I didn't get a full result.
Results: 240whp and 380wtq
Crank horsepower: 289hp and 457ft-lbs
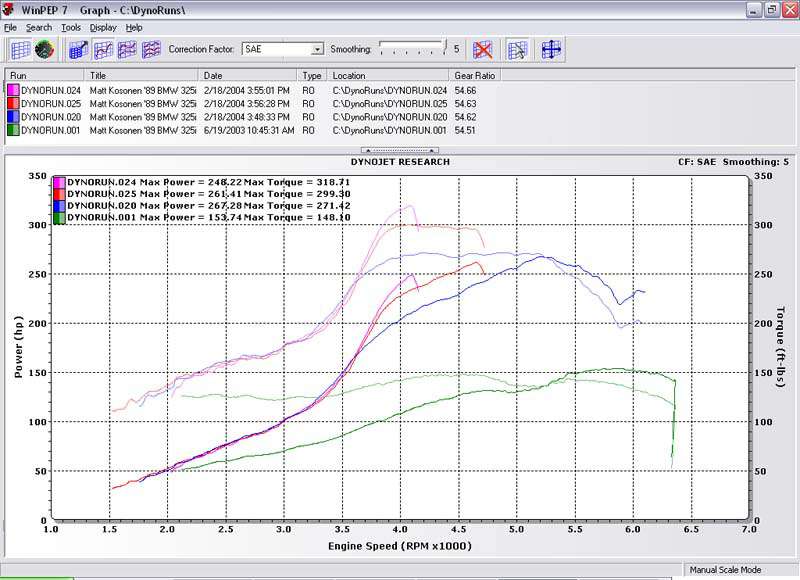
This is an old graph from 2003 and 2004. The Green run is when I was a naturally
aspirated 2.8l low compression with 19lb/hr injectors and stock engine
management. The blue run was 12psi, red run was 15psi, and the pink run
was 18psi. These are lower than my current graphs because I was using a
2.5" exhaust (and the later runs had to be shut down due to detonation caused by
the backpressure) and other things, such as 32lb/hr injectors. The results
are on the photo for each run.
|
|
